 PopHumanScan
The collaborative selection catalog of human adaptation
Since the split with chimpanzees, and especially since the migrations that lead humans colonize almost every single place on Earth, we have been exposed to frequent environmental and social changes that have shaped our genomes through the action of natural selection. The availability of a comprehensive worldwide nucleotide variation data set from the 1000 Genomes Project (1000GP) provides the human lineage with an invaluable resource, allowing the testing of molecular population genetics hypotheses and eventually understanding the evolutionary dynamics of genetic variation in human populations.PopHumanScan contains the most exhaustive characterization of human adaptive events. We have identified regions of the genome that have been subjected to either recent sweeps or recurrent selection since the split between our species and chimpanzees. Our genome-wide scan of selection includes 2,863 genomic regions showing signatures of positive selection based on three type of selection evidences, of which 1,453 (50,75%) overlap with genes and, intriguingly, 1,338 (46,73%) overlap introgressed haplotypes from Neanderthal or Denisova. Well-known examples of human genetic adaptation published elsewhere are included in the catalog, as well as hundreds of other interesting candidates that will require a more thoroughly analysis. To ease this analysis, the catalog facilitates comparisons of each signature of selection with empirical distributions of the corresponding DNA diversity metric across the human genome and in 22 non-admixed 1000GP populations, and structural and functional annotations of the region.
- General help
- Data description
- Statistics description
- Structural and functional annotations
- Tutorial
- How can I contribute?
- Contact
General help
The side navigation bar gives you quick access to all the webpage functions. Redirects you to the catalog itself. Allows the user to add a new entry. The user must be logged in to use this functionality. Contact us for registering. Contains the main user configuration options: login, registration, password management. Provides a contact form that allows the user to contact the developers.Data description
The 1000 Genomes Project (1000GP) set out to provide the most comprehensive description of human genetic variation by applying whole-genome sequencing to a diverse set of individuals from populations. In the final phase of the project (Phase 3), the consortium published the reconstruction of the genomes of 2,504 individuals from 26 populations using a combination of low-coverage whole-genome sequencing, deep exome sequencing, and dense microarray genotyping (The 1000 Genomes Project Consortium 2015). With 84.7 million single nucleotide polymorphisms (SNPs), the resource is estimated to include >99% of SNP variants with a frequency of >1% for a variety of ancestries.We have retrieved the population genomic data from PopHuman, which represents the most complete pipeline for population genomics analysis of the 1000GP data.
The 26 analyzed 1000GP populations (The 1000 Genomes Project Consortium 2015) are listed in the interactive map (Figure 1).
Statistics description
There are many methods and statistics to perform genome scans to detect local adaptation. In PopHumanScan, we have included selection tests based on the allele frequency spectrum and the levels of variability (Tajima’s D, Fu and Li’s D and F, Fay and Wu’s H); selection tests based on comparisons of polymorphism and divergence and its derived estimators (MKT, α); selection tests based on the linkage disequilibrium (iHS and XP-EHH) and selection tests based on population differentiation (FST) (Table 1). The combination of different measures are necessary for a complete description of the footprint that natural selection has left in the genome.Tests are grouped in three categories depending on the signature type: Protein Changes (⬤, many millions of years), Site Frequency Spectrum (⬤, <250 kya) and Linkage Disequilibrium (⬤, <30 kya).
Because these statistics, except α (MKT), do not provide a formal significance test, significance was assessed by identifying the most extreme values in the empirical distribution of the statistics (i.e., considering values falling in the lower or higher 0.05% tail). The significance indicates that a locus in an outlier with respect to the rest of the genome.
Linkage Disequilibrium signatures:
- iHS and XP-EHH. iHS and XP-EHH tests are largely complementary: iHS has good power to detect selective sweeps at moderate frequency (50%–80%), but low power to detect sweeps that have reached high frequency (>80%) or fixation; in contrast, XP-EHH is more powerful for detecting selective sweeps with haplotypes at above 80% frequency.
- FST: a statistic that quantifies levels of differentiation between subpopulations. Under neutrality, levels of FST are largely determined by genetic drift and migration, but local adaptation can accentuate levels of population differentiation at a particular locus thus result in in large FST values.
- Fay and Wu’s H: this statistic detects the presence of an excess of high frequency derived alleles in a sample, indicator of positive selection.
- Tajima’s D: this statistic measures the difference between two estimators of the population variability (θ and π). Under neutrality, the means of θ and π should approximately equal one another. Therefore, the expected value of Tajima’s D for a population conforming to a standard neutral model is zero. Significant deviations from zero indicate a skew in the allele frequency distribution relative to neutral expectations. Positive values of Tajima’s D arise from an excess of intermediate frequency alleles and can result from population bottlenecks, structure and/or balancing selection. Negative values of Tajima’s D indicate an excess of low frequency alleles and can result from population expansions or positive selection.
- Fu and Li’s D and F: this set of tests is similar to Tajima’s D in that it tests for a skew in the allele frequency spectrum, but makes the distinction between old and recent mutations as determined by where they occur on the branches of genealogies. The expected value is also zero; significant deviations from zero are informative about distinct demographic and/or selective events.
- α (MKT): the combination of polymorphism and divergence data allows the estimation of the proportion of substitutions that are adaptive, while correcting for the presence of slightly deleterious substitutions. Only protein coding genes with some variability in both polymorphism and divergence were considered, and the α of genes were determined as significant using Fisher’s exact test with a p-value < 0.05.
Structural and functional annotation
The regions of the genome that departure from the neutrality expectations are further characterized with the structural and functional annotations of that particular region extracted from the UCSC.Sequencing and annotations
- Mappability: represents the percentage of bases in the region that are mappable, i.e., does not present any troublesome due to high throughput sequencing aligners.
- Distance to closest GAP: shows the distance (in Mb) to the closest gap.
- CpG Islands: shows the percentage of overlap with the CpG islands contained in that region.
- Transcription Factor Binding Sites: shows the total number of TFBSs that the region contains.
- ORegAnno Regulatory Elements: displays the total number of curated regulatory regions, TFBSs and regulatory polymorphisms.
- Vista Enhancers: displays the percentage of overlap with enhancers.
- PhyloP Evolutionary Conservation: shows the percentage of bases that have a score ≥ 2.
- phastCons Evolutionary Conservation: shows the percentage of bases that overlap with PhastCons conserved elements.
- GERP Constrained Elements: shows the percentage of bases that have a score ≥ 2 (constrained sites).
- InvFEST Inversions: shows the percentage of bases in the region that overlaps with validated inversions from the InvFEST database.
- DGV Structural Variants: shows the percentage of bases in the region that overlap with annotations from the Database of Genomic Variants (DGV): CNV, indels and inversions.
- RepeatMasker: shows the percentage of bases in the region that overlap with repetitive elements.
- Segmental Duplications: shows the percentage of the region that overlap segmental duplications.
- TRF Simple Tandem Repeats: shows the percentage of bases in the region that overlap with tandem repeats, located by Tandem Repeats Finder (TRF).
- Archaic Introgression: shows the percentage of bases in the region that overlap with either Neanderthal or Denisova introgressed haplotypes.
- Neanderthal: shows the percentage of bases in the region that overlap with Neanderthal introgressed haplotypes. Additionally, this percentage has been calculated separately for three metapopulations, EUR, SAS and EAS.
- Denisovan: shows the percentage of bases in the region that overlaps with Denisova introgressed haplotypes.
Tutorial
About this tutorial
PopHumanScan contain regions of the genome with footprints of the action of natural selection of the human evolution since the split with chimpanzees. The catalog facilitates comparisons of each signature of selection with empirical distributions of the corresponding DNA diversity metric across the human genome and among populations, as well as and structural and functional annotations of the region.How can I filter regions of interest?
Imagine your research group is interested in protein coding genes that have experienced selective sweeps based on Linkage Disequilibrium signatures in European populations. To filter candidate regions, go to the PopHumanScan Catalog and move down to the page to find the Basic Filters. Click "Linkage Disequilibrium" under the Select a signature menu, "European" under the Select a population menu, and "Coding" under the Select a region type menu (Figure 2). Note that the table has reduced the number of entries to 102, and that the regions are not specific of Europeans, but also display the ones shared with other populations. The same occurs with the signature type, as a region can contain more than one type of signal involving different types.Have a look at the filtered table (Figure 3):
-
The first column contains the coordinate of the region (hg19 annotation). The minimum size is 10kb, as we obtained windows of that size from PopHuman. If the region spans >10kb, then we show the coordinates of the enlarged region. The value of the statistics shown in the table correspond to the most extreme values of the 10kb windows included.
- The next column contains the name of the genes that are contained (or partially overlap) the region. Because we have filtered for coding regions, all the entries shown here have a gene annotated in this column.
- The following eight consecutive columns contain the most extreme values of each statistic in each region. If the number appears in red or green, it is an outlier (<0.0005) in the empirical distribution, either in the positive (green) or negative (red) tail. The value is displayed in gray otherwise. NA means that the particular region could not be analyzed for that statistic.
- Two color-coded columns display the metapopulation in which adaptation is detected and the estimated age of the event. Hovering over the dots indicate the populations (⬤ European, ⬤ African, ⬤ South Asian and ⬤ East Asian) or signature type (⬤ Protein Changes, ⬤ Site Frequency Spectrum and ⬤ Linkage Disequilibrium).
- The last column indicates the data source. Currently, we have only included regions detected with our pipeline using the phase 3 of the 1000GP data, that we have labelled as PopHumanScan.
Characterizing a sweep
Region and Genes descriptionClick the icon in the first row of the sorted table. A small section is displayed that specifies in which populations evidences of positive selection have been detected (Figure 4). In the selected example, there are four signals (Fu & Li's D, iHS, XP-EHH and α MKT) for several populations worldwide. Below, colored boxes indicate that the region overlaps several functional and structural features. Click See complete report of this region for the complete characterization.
The first section shows the structure and functional annotation of this region (see Structural and functional annotations) (Figure 5). In the example, the >95% of the region overlap haplotypes introgressed from Neanderthal.
In addition, some links to other databases describing that region are included: PopHuman, that complements the population genomics information, HaploReg, which allows the exploration of annotations of noncoding variants, and Ensembl, which allows the exploration of the linkage disequilibrium of the region.
The second part lists genes encoded in the region (Figure 6). For each encoded gene, it provides a short description of the gene along with Gene Ontology terms associated with it. It also includes eight different links to other databases to complement the information for this gene: Ensembl, NCBI, Uniprot, UCSC, Expression Atlas, OMIM, OpenTargets and HumanMine.
The third part contains cross-linked References to published articles that support the signal of adaptation found in the region. You must be registered and logged in to contribute in this area.
Recombination distribution
An Interactive graph shows the recombination values in 10kb non-overlapping windows along the corresponding chromosome in which the region is located. The specific location of the region is indicated with dashed vertical lines.
Statistics
Finally, boxplots show the distribution of each significant statistic in all the populations (Figure 7). Highlighted values correspond to those in the selected region, and those in red are outliers of the empirical distribution (P < 0.0005).
Using PopHuman to further characterize a region
PopHuman can be used as a complementary exploratory tool of the region. Clicking in the PopHuman button will redirect you to the browser. Additional tracks can be activated: (i) frequency-based nucleotide variation; (ii) divergence-based metrics; (iii) linkage disequilibrium; (iv) recombination; (v) selection tests based on the Site Frequency Spectrum (SFS) and/or variability and (vi) selection tests based on the MKT.
How can I contribute?
Adding a new selective event
If you have detected positive selection in a region that is not present in the database, you can add it using the tool in the Edit page (Figure 8). The tool consists of a simple form where you need to define the coordinates of the region, the gene (if any) overlapping the region, and the value(s) of the statistics you measured, specifying the population of study. If you found more than one significant statistic or measured it in more than one population, you can click on the button. Clicking will remove the line. Finally, specify the data source you used.To use this tool, you must be logged in. If you do not have an account, contact us for registering in the site. The introduced data will be subjected to manual curation and will be clearly labelled with your ID.
Adding references
You can manually enter papers supporting a region already present in the catalog. Enter the report of the region and add PubMed IDs in the corresponding section (Figure 9).Licences and copyrights
PopHumanScan icon made by Freepik from flaticon and modified by PopHumanScan.uab.cat.Cookies banner from Bootstrap-Cookie-Alert.
Contact
Feel free to contact us through the contact form in case you have questions about PopHumanScan or experience any technical problem. Suggestions to improve our site are welcomed!Figure 1
Table 1
| Measure/Test | Description | Reference |
|---|---|---|
| Nucleotide diversity measures | ||
| π | Nucleotide diversity: average number of nucleotide differences per site | Jukes and Cantor (1969); Nei and Gojobori (1986); Nei (1987) |
| θ | Nucleotide polymorphism: proportion of nucleotide sites that are expected to be polymorphic | Watterson (1975); Tajima (1983, 1996) |
| Selection tests based on the allele frequency spectrum and/or levels of variability | ||
| ⬤ Tajima’s D | Number of nucleotide polymorphisms with the mean pairwise difference between sequences | Tajima (1989) |
| ⬤ Fu and Li’s D | Number of derived nucleotide variants observed only once in a sample with the total number of derived nucleotide variants | Fu and Li (1993) |
| ⬤ Fu and Li’s F | Number of derived nucleotide variants observed only once in a sample with the mean pairwise difference between sequences | Fu and Li (1993) |
| ⬤ Fay and Wu’s H | Number of derived nucleotide variants at low and high frequencies with the number of variants at intermediate frequencies | Fay and Wu (2000) |
| Selection tests based on comparisons of polymorphism and divergence between different classes of mutation | ||
| MK | Ratios of synonymous and non-synonymous nucleotide divergence and polymorphism | McDonald and Kreitman (1991) |
| Estimators derived from extensions of the MK test | ||
| ⬤ α | Proportion of substitutions that are adaptive | Charlesworth et al. (1994); Smith and Eyre-Walker (2002) |
| Selection tests based on LD | ||
| ⬤ iHS | Integrated haplotype score, based on the frequency of alleles in regions of high LD | Voight et al. (2006) |
| ⬤ XP-EHH | Long-range haplotype method to detect recent selective sweeps | Sabeti et al. (2007) |
| Population differentiation and associated selection tests | ||
| ⬤ FST | Average levels of gene flow based on allele frequencies, under the infinite-sites model | Hudson et al. (1992) |
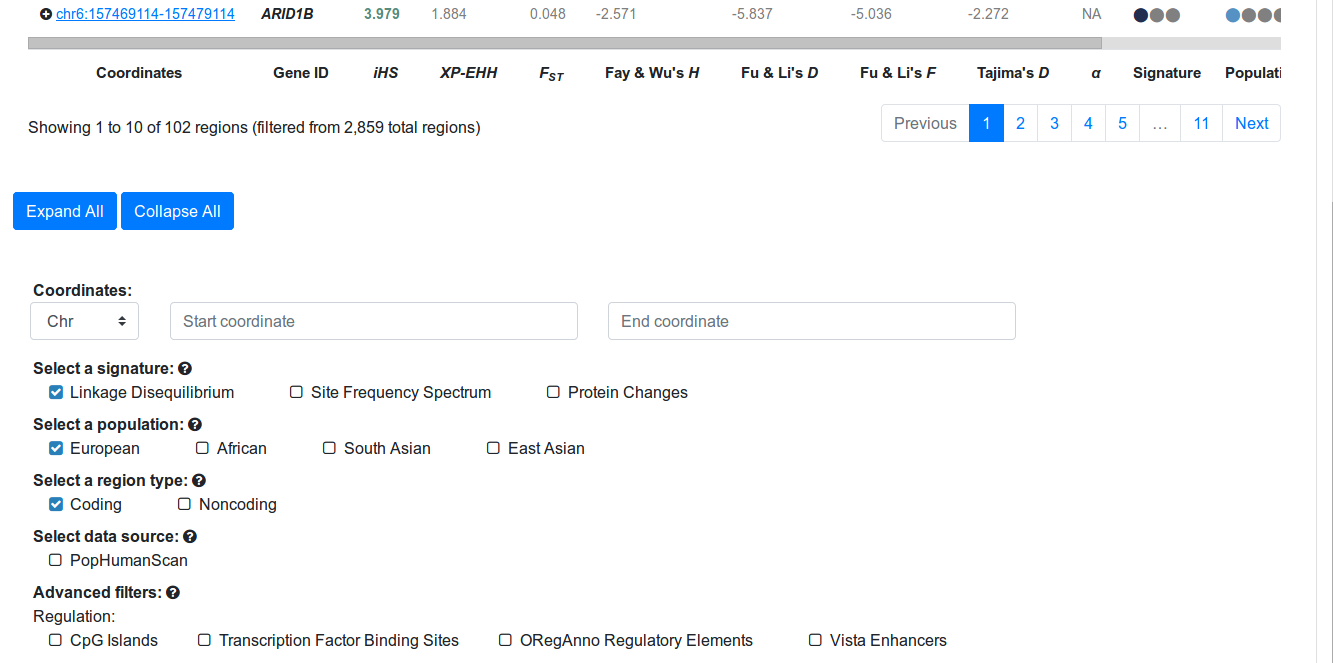
Figure 2
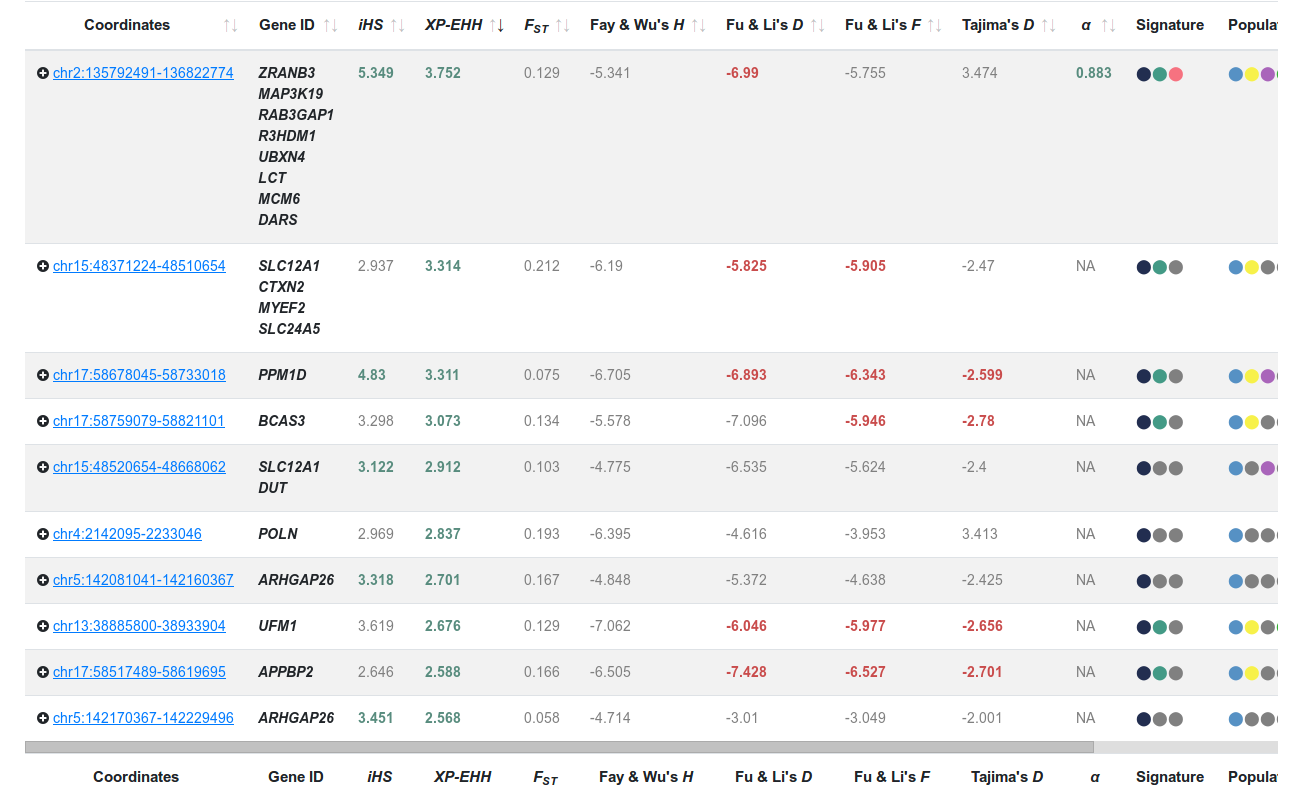
Figure 3
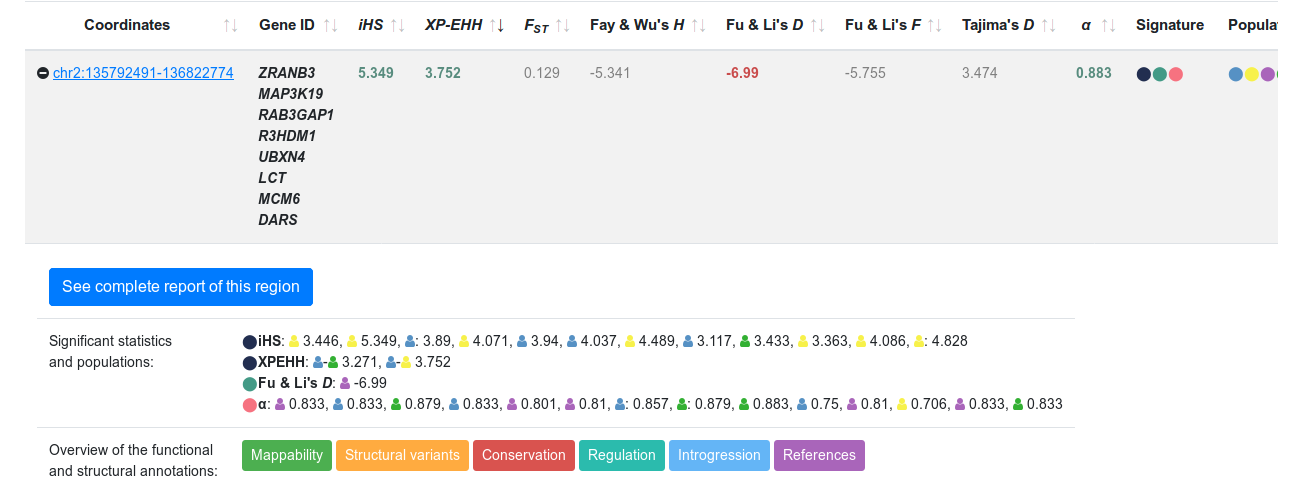
Figure 4
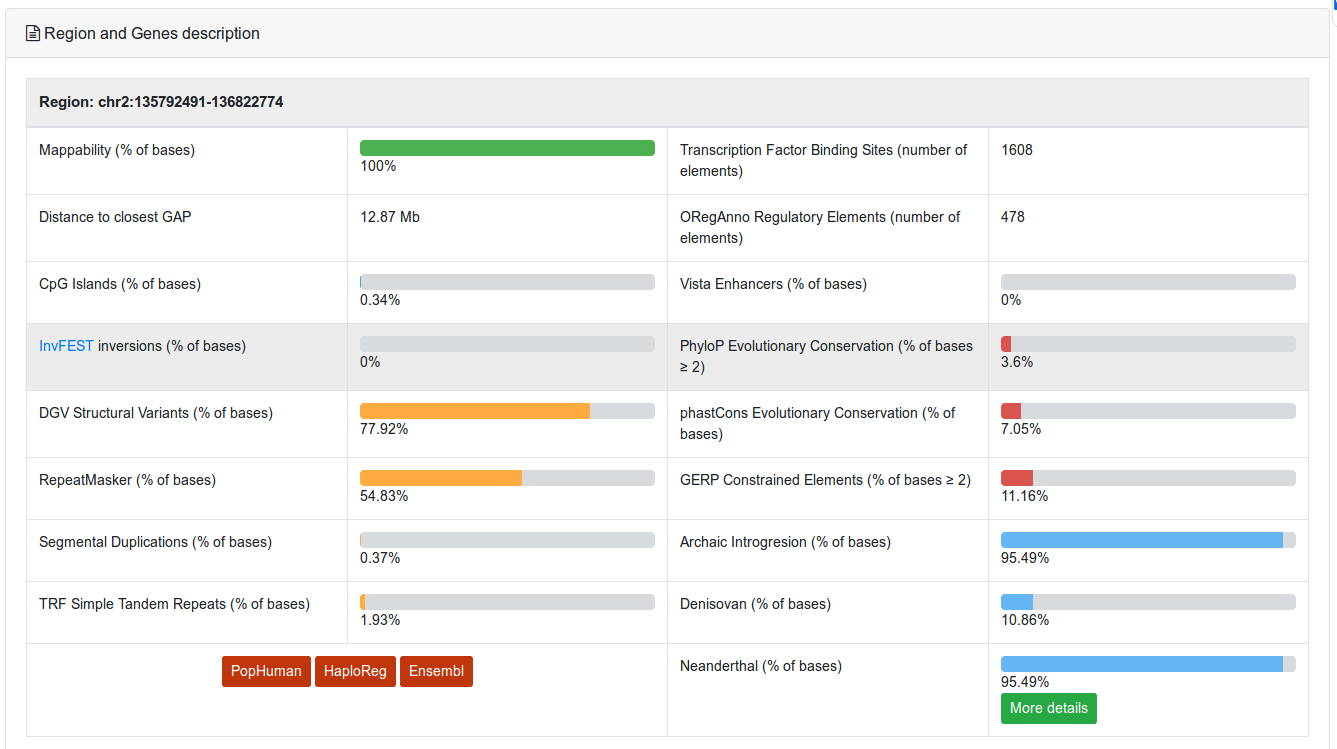
Figure 5
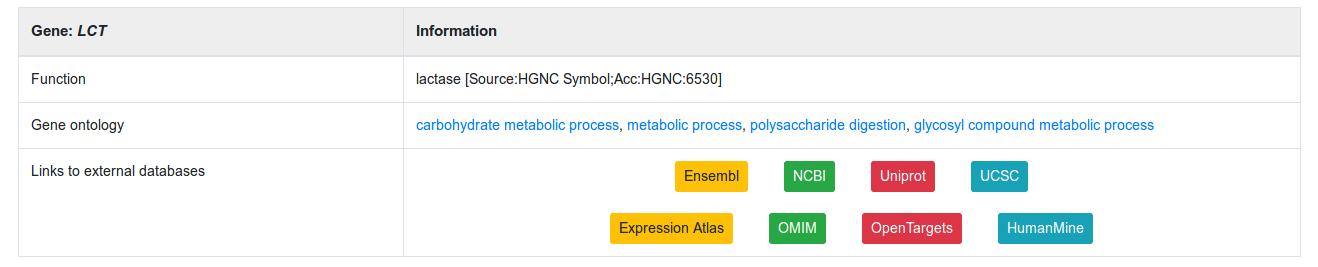
Figure 6
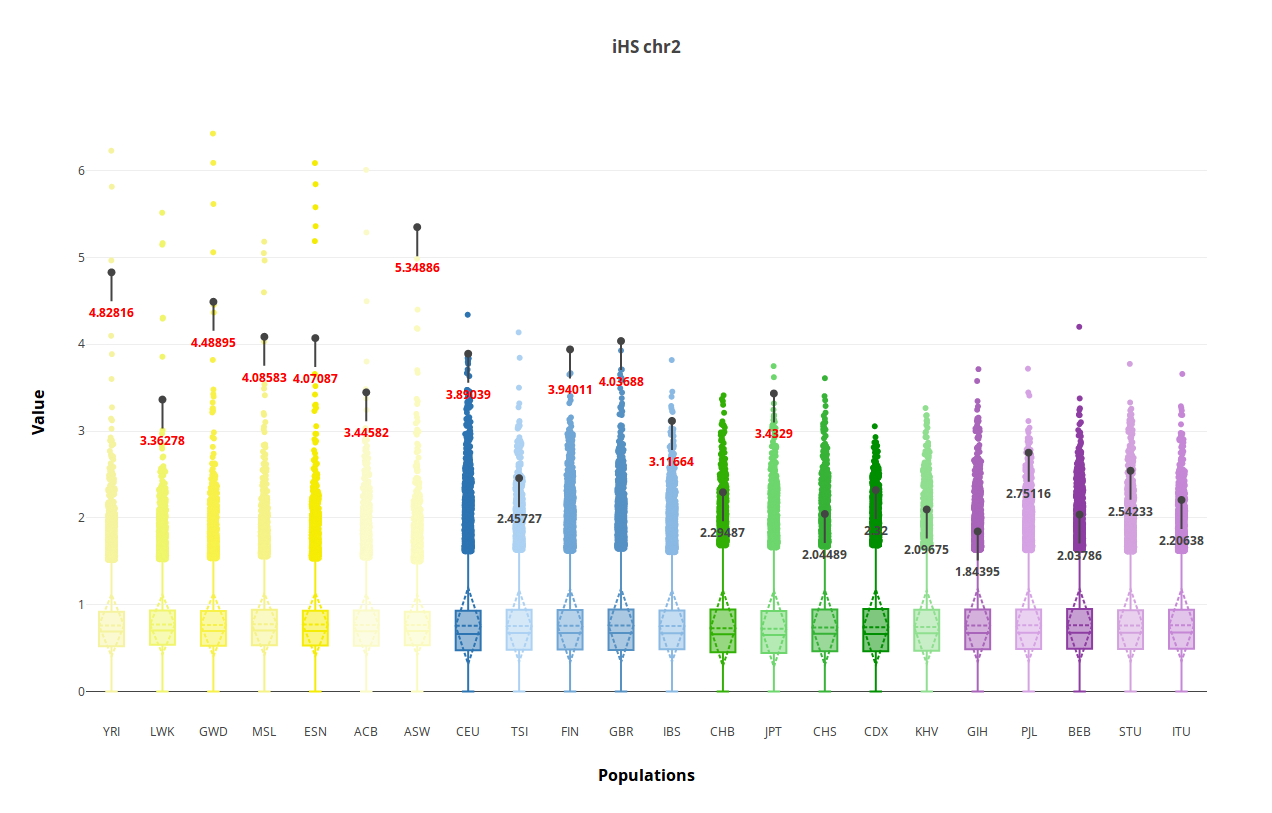
Figure 7
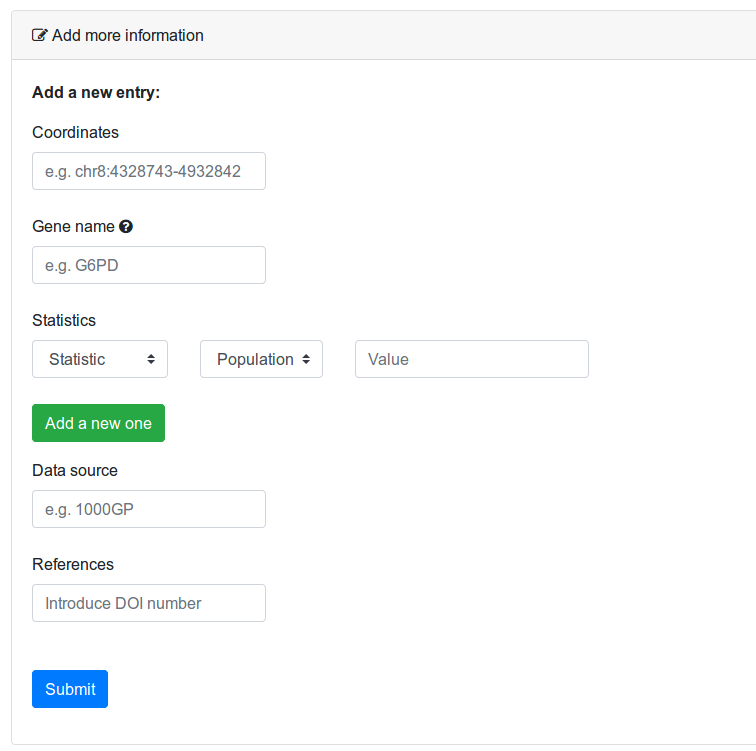
Figure 8

Figure 9